Frequencies & Waveforms For EVP Analysis – Paranormal Science

This article is more than three years old and was last updated in August 2021.
This method of spirit communication is called electronic voice phenomenon or EVP, and the deeper you get into it, the more likely you are to encounter lots of scientific jargon and terms like frequency, amplitude, wavelength and pitch. Knowledge of these key terms is vital when examining a waveform, but if you’ve forgotten what you were taught in high school science, then you might find it all a bit baffling. Below is a guide to understanding the way audio waveforms work.
What Is A Waveform?

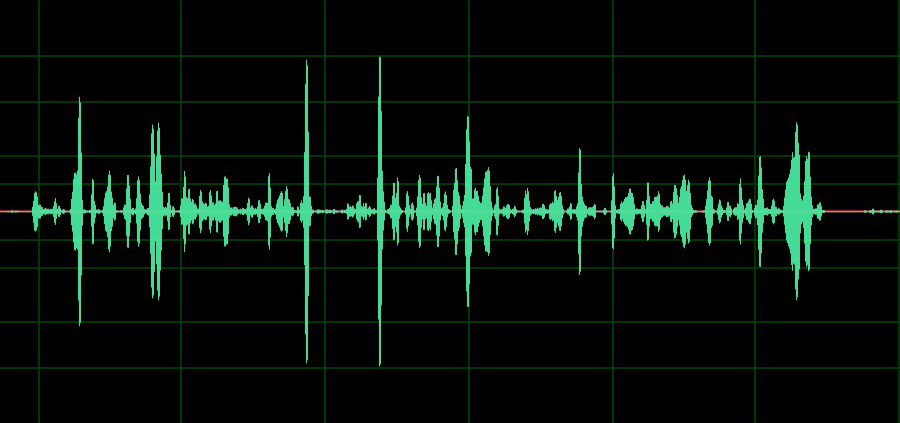
The best way to analyse a waveform is using software such as Adobe Audition or Audacity. These applications allow you to view the waveform, zoom into it in order to pick out sounds in the recordings and amplify them. When looking at a waveform as a whole recording it’s hard to pick out anything useful, as the image above shows. However, it is clear to see areas of loud noise and silence.
Sound waves in a recording will normally be fluctuating vibrations consisting of many different frequencies and amplitudes, but to simplify things, we’re going to introduce you to the parts of a uniform oscillating wave.
Advertisement ‐ Content Continues Below.
Parts Of A Wave

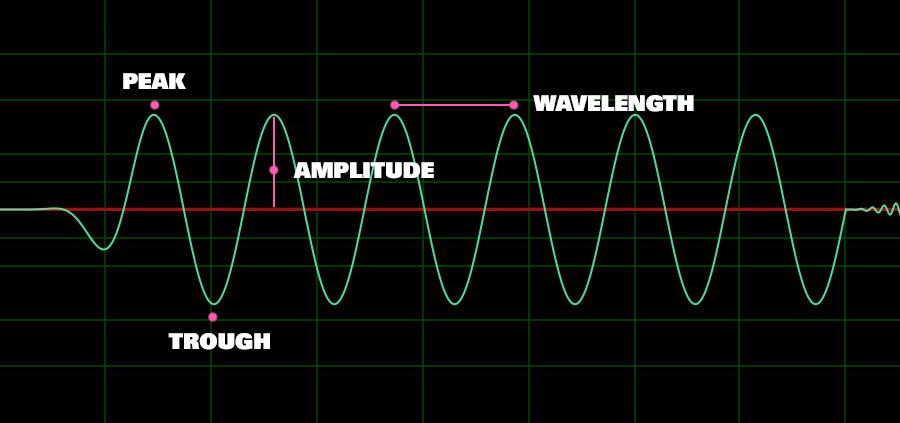
In the diagram above, you can see the important parts of a waveform, which you should understand in order to properly analyse an EVP session that you’ve recorded. These parts are:
Peak – the highest point above the rest position (the red line through the centre of the wave)
Trough – the lowest point below the rest position
Amplitude – the maximum displacement of a point of a wave from its rest position
Wavelength – distance covered by a full cycle of the wave, usually measured from peak to peak, or trough to trough
Stop Getting Frequency Wrong
Another important property of a wave is its frequency, something which is commonly misunderstood in the paranormal field. It can’t be measured directly by looking at a waveform, but can be calculated. The frequency of a waveform is what determines the pitch, we either hear the sound as low pitched or high pitched. It is measured in Hertz (Hz) as the number of waves passing a point each second.
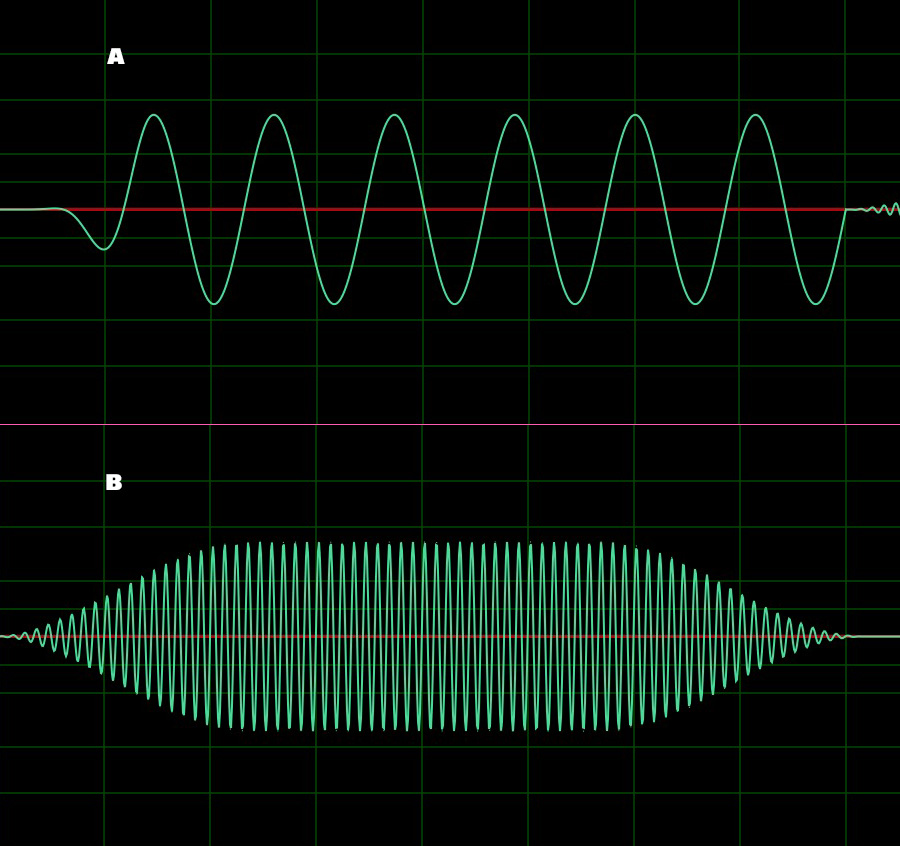
In the example below, the top waveform (A) has a lower frequency and therefore pitch than the bottom waveform (B), which will sound higher pitched.

It seems to be a common misconception that the height of a wave or the presence of peaks is an indication of its frequency. As the diagram above shows, this is not the case as waves A and B are the same height (amplitude), however the higher number of full cycles of the wave over the same time period in wave B shows that it has a higher frequency than wave A.
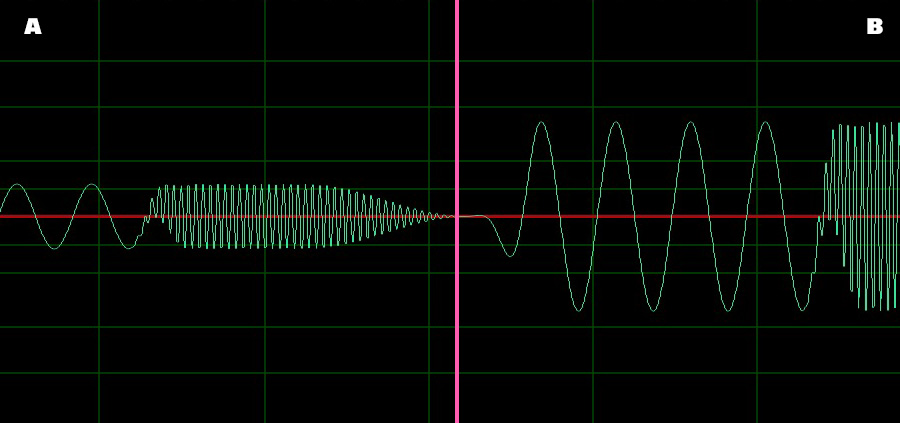
Below we can see two sounds, A and B. Both are made up of varying frequencies. Each of the two sounds starts at a low pitch but becomes higher. Wave B is much taller than wave A, this indicates that it has a higher amplitude, measured in decibels (dB).

When analysing the audio in order to pick out EVPs, you will most likely amplify the recording to see its features more clearly. Amplifying the audio increases its amplitude and the wave will appear taller, but it doesn’t affect that waveform’s frequency or wavelength. These two properties are independent of the amplitude.
In reality, your waveforms won’t be as clear as these examples, especially when dealing with speech as every voice has a different pitch and words are made up of various different sounds and tones, which merge into one erratic waveform that may also include background noise.


